
Fichier:Components of the Cryosphere.tif
Taille de cet aperçu PNG pour ce fichier TIF : 463 × 599 pixels. Autres résolutions : 185 × 240 pixels | 371 × 480 pixels | 593 × 768 pixels | 791 × 1 024 pixels | 2 048 × 2 650 pixels.
Fichier d’origine (2 048 × 2 650 pixels, taille du fichier : 20,91 Mio, type MIME : image/tiff)
| Ce fichier et sa description proviennent de Wikimedia Commons. | Accéder au fichier sur Commons |
Description
| Description |
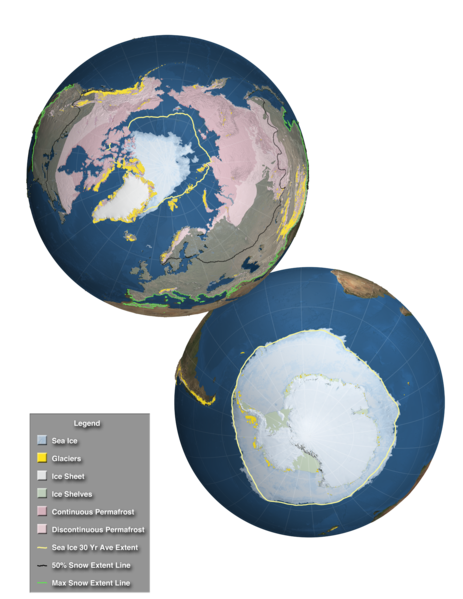
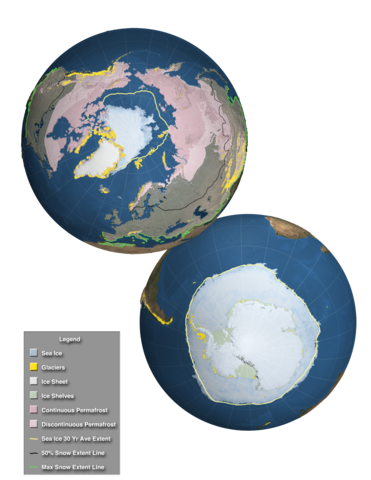
English: This high resolution image, designed for the Fifth Assessment Report of the Intergovernmental Panel on Climate Change, shows the extent of the regions affected by components of the cryosphere around the world. Over land, continuous permafrost is shown in a dark pink while discontinuous permafrost is shown in a lighter shade of pink. Over much of the northern hemisphere's land area, a semi-transparent white veil depicts the regions that are affected by snowfall at least one day during the perion 2000-2012. The bright green line along the southern border of this region shows the maximum snow extent while a black line across the North America, Europe and Asia shows the 50% snow extent line. Glaciers are shown as small golden dots in mountainous areas and in the far northern and southern latitudes. Over the water, ice shelves are shown around Antarctica along with sea ice surrounding the ice shelves. Sea ice is also shown at the North Pole. For both poles. the 30 year average sea ice extent is shown by a yellow outline. In addition, the ice sheets of Greenland and Antarctica are clearly visible. |
| Date | |
| Source | Goddard Multimedia |
| Auteur | NASA/Goddard Space Flight Center Scientific Visualization Studio |
Conditions d’utilisation
| Ce fichier provient de la NASA. Sauf exception, les documents créés par la NASA ne sont pas soumis à copyright. Pour plus d'informations, voir la politique de copyright de la NASA. | ||
 |
Attention :
|
Historique du fichier
Cliquer sur une date et heure pour voir le fichier tel qu'il était à ce moment-là.
| Date et heure | Vignette | Dimensions | Utilisateur | Commentaire | |
|---|---|---|---|---|---|
| actuel | 3 décembre 2013 à 14:22 |  | 2 048 × 2 650 (20,91 Mio) | Originalwana | {{Information |Description ={{en|1=This high resolution image, designed for the Fifth Assessment Report of the Intergovernmental Panel on Climate Change, shows the extent of the regions affected by components of the cryosphere around the world. Over... |
Utilisation du fichier
Les 2 pages suivantes utilisent ce fichier :
Usage global du fichier
Les autres wikis suivants utilisent ce fichier :
- Utilisation sur azb.wikipedia.org
- Utilisation sur de.wikipedia.org
- Utilisation sur es.wikipedia.org
- Utilisation sur eu.wikipedia.org
- Utilisation sur he.wikipedia.org
- Utilisation sur hi.wikipedia.org
- Utilisation sur ja.wikipedia.org
- Utilisation sur ky.wikipedia.org
- Utilisation sur la.wikipedia.org
- Utilisation sur sr.wikipedia.org
- Utilisation sur sv.wikipedia.org
- Utilisation sur th.wikipedia.org
- Utilisation sur vi.wikipedia.org
- Utilisation sur www.wikidata.org
- Utilisation sur zh-yue.wikipedia.org